Observability Course Labs
Prometheus
Prometheus is an open-source monitoring solution. It's a CNCF project (under the same foundation as Kubernetes), and it runs a whole suite of monitoring components.
Reference
- Prometheus documentation
- Download and installation details
- Configuration and service discovery
- Prometheus HTTP API documentation
Run Prometheus
We'll run Prometheus in a Docker container:
- prometheus.yml - is the container setup, publishing port 9090
- config/prometheus.yml - is the Prometheus configuration file.
Start the container:
docker-compose -f labs/prometheus/prometheus.yml up -d
Browse to the Prometheus UI at http://localhost:9090
The default page lets you query metrics - we'll do that shortly. First check some other pages:
- http://localhost:9090/config (from the Status...Configuration menu) - shows the config Prometheus is using
- http://localhost:9090/targets (from Status...Targets menu) - shows the status of the scrape targets
None of the targets we want to monitor are running, but Prometheus will keep trying to find them.
This Docker Compose file (apps.yml) starts all the apps we used in the metrics lab. The containers will connect to the same Docker network as Prometheus, and they're using the DNS names Prometheus is expecting to find.
Run the apps:
docker-compose -f labs/prometheus/apps.yml up -d
Refresh the status page at http://localhost:9090/targets and you'll see the targets come online
Switch to the Graph page using the Classic UI. The dropdown shows you a list of all the metrics collected.
The simplest query just needs the metric name.
📋 What do you see when you query process_cpu_seconds_total and app_info?
Need some help?
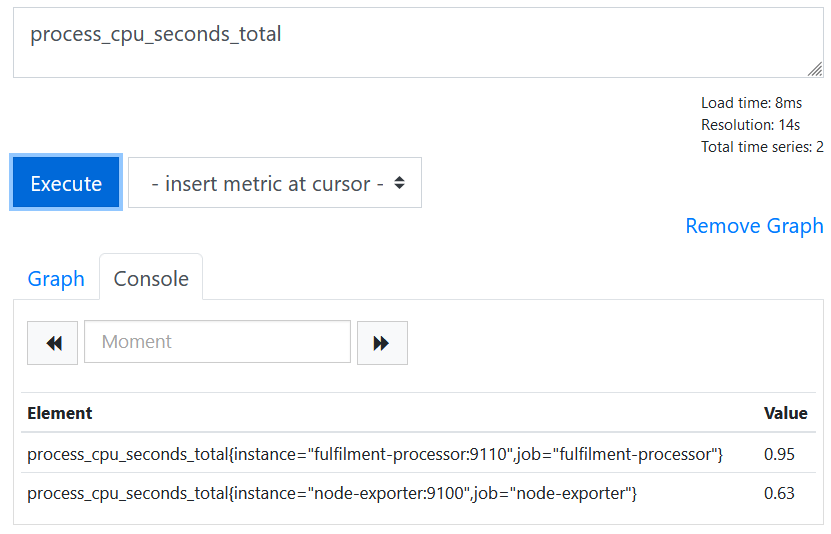
Enter process_cpu_seconds_total in the query expression and hit Execute. You'll see two metric values in the output:

That tells you how much CPU time the node exporter and the document processor have used.
Query app_info and you'll see output like this:
|Element|Value|
|-|-|
|app_info{app_version="1.3.1",assembly_name="Fulfilment.Processor",dotnet_version="3.1.16",instance="fulfilment-processor:9110",job="fulfilment-processor"}|1|
|app_info{instance="fulfilment-api:80",java_version="11-jre",job="fulfilment-api",version="0.3.0"}|1|
These are informational metrics, showing the application and runtime version numbers for the document processor and REST API.
When Prometheus scrapes a target it adds two labels to every metric:
job- the name of the configured job, typically used to identify one component e.g. the document processorinstance- the specific instance of the target, typically one server or one container, e.g.fulfilment-processor:9110is the DNS name and port of the processor target
Prometheus also records a timestamp for each metric, so for every piece of data you know where it came from and when it was collected.
Time-series data
The Console view in the Graph page just shows the most recent metric value. Prometheus is currently scraping each target every 30 seconds and recording all metrics in its time-series database.
You can use the Graph page to explore that data.
📋 Query fulfilment_requests_total metric, then amend the query so you only show the value of the processed label.
Need some help?
Execute a query for fulfilment_requests_total and you'll see output like this:
|Element|Value|
|-|-|
|fulfilment_requests_total{instance="fulfilment-processor:9110",job="fulfilment-processor",status="failed"}|777|
|fulfilment_requests_total{instance="fulfilment-processor:9110",job="fulfilment-processor",status="processed"}|17701|
Labels are key-value pairs shown in curly braces, and you can use the same syntax in the query to show metrics matching the label.
Querying fulfilment_requests_total{status="processed"} shows just the processed count.
Prometheus calls this result an instant vector, because it's just showing the data for one instant - the most recent value collected.
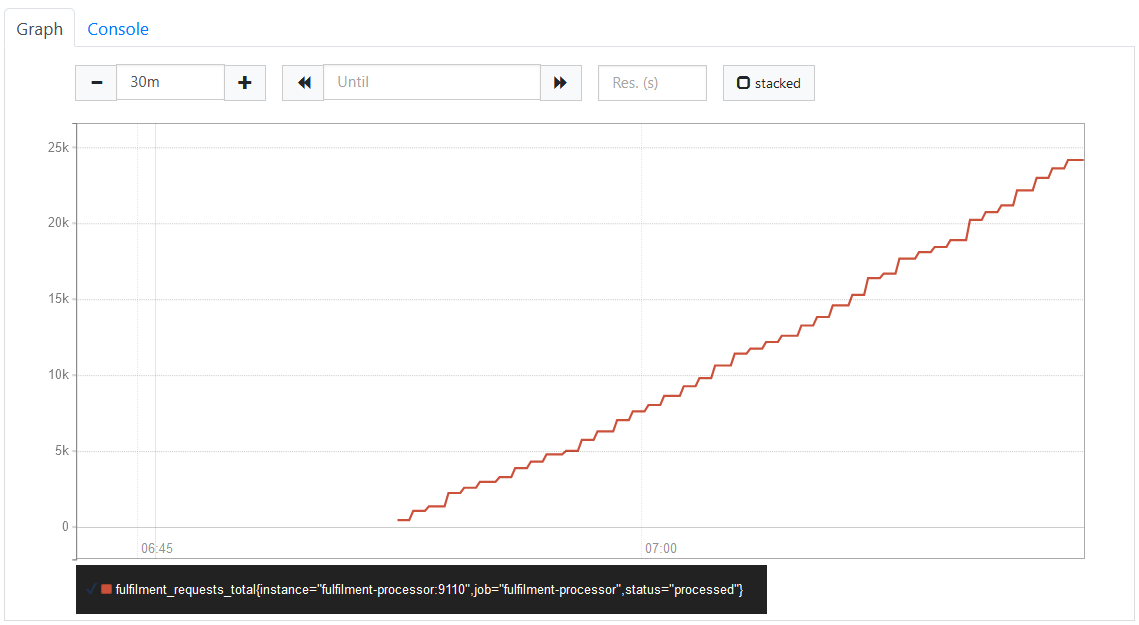
Hit the Graph button and you'll see the results over a range of time, plotted into a graph where you can select the time range:

That metric is a counter, so the graph continually increases.
📋 Build a graph for the fulfilment_in_flight_total metric, and another for the fulfilment_requests_total metric (without a label selector). How do they compare?
Need some help?
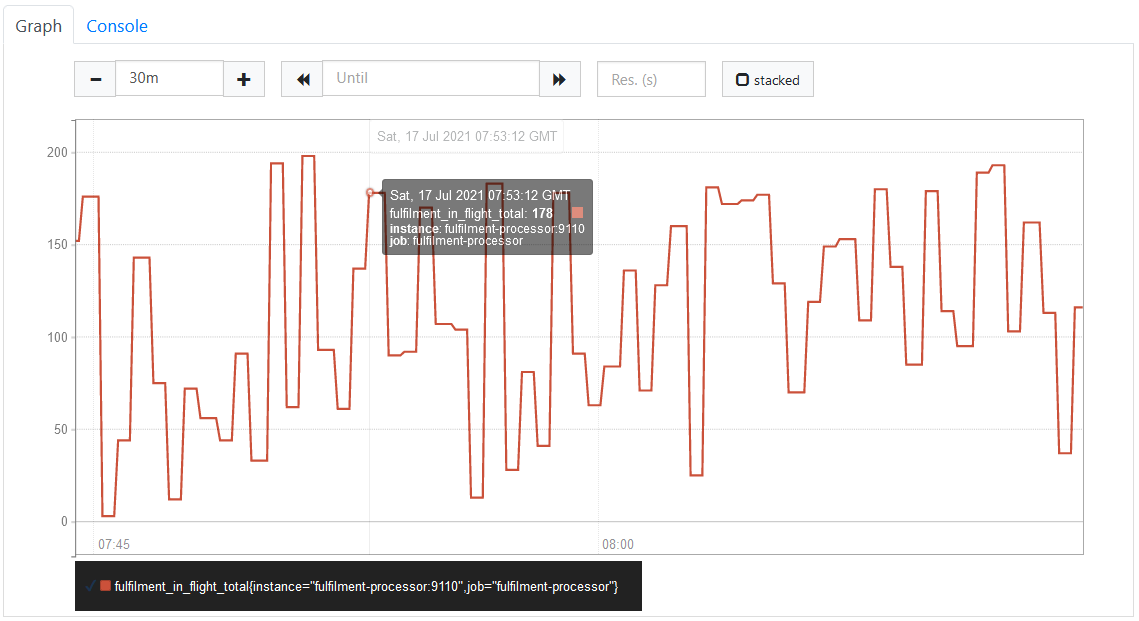
fulfilment_in_flight_total is a gauge metric, so the graph will show values going up and down:

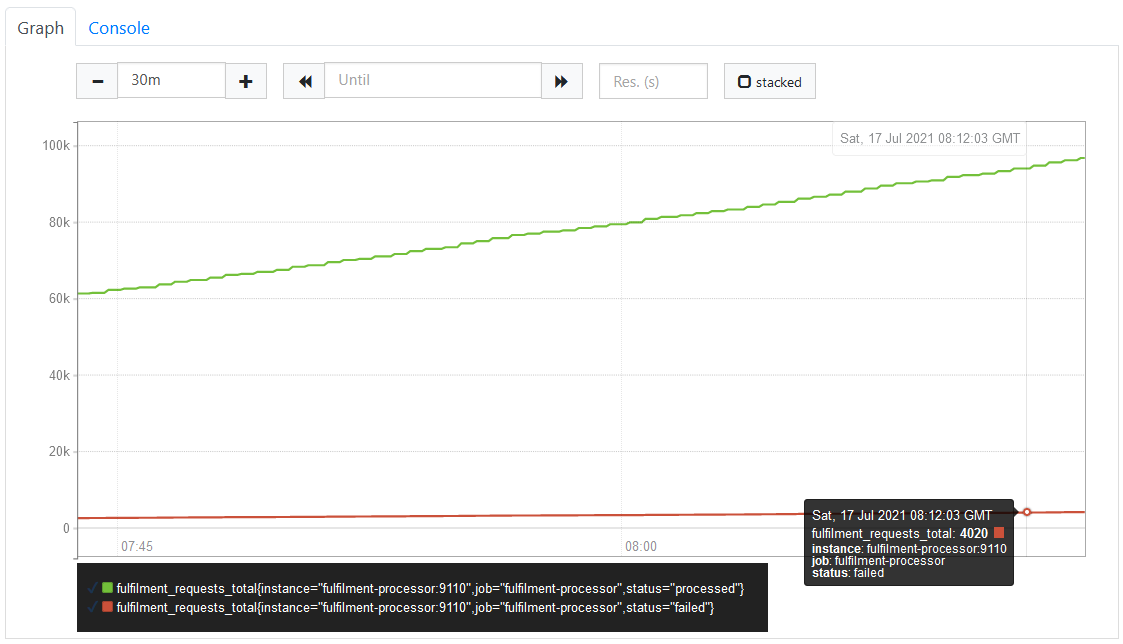
fulfilment_requests_total has multiple metrics for different status labels; Prometheus plots a line for each metric:

The Prometheus UI is a good way to explore data and build up simple queries, but you can't use it to create a full dashboard. For that you'll use Grafana, which sends queries to the Prometheus HTTP API.
Query API
You don't usually work with the query API directly, but it's a good resource to see the raw data for query results.
It's a simple HTTP API which you can call with curl.
If you're a Windows user run this script to use the correct curl command:
# first enable scripts:
Set-ExecutionPolicy -ExecutionPolicy Unrestricted -Scope Process

# then run:
. ./scripts/windows-tools.ps1
Make a query for the in-flight document metric:
curl 'localhost:9090/api/v1/query?query=fulfilment_in_flight_total'
You'll see output in JSON, something like this (but not nicely formatted):
{
  "status": "success",
  "data": {
    "resultType": "vector",
    "result": [
      {
        "metric": {
          "__name__": "fulfilment_in_flight_total",
          "instance": "fulfilment-processor:9110",
          "job": "fulfilment-processor"
        },
        "value": [
          1626510033.385,
          "71"
        ]
      }
    ]
  }
}
This is an instant vector. The actual value is returned as a string, 71 in this example, and it includes the timestamp when the value was recorded (as a Linux epoch - 1626510033.385 is Saturday, 17 July 2021 08:20:33.385).
📋 Use the API to query the up metric. What do you think the response tells you?
Need some help?
The query can just use the metric name:
curl 'localhost:9090/api/v1/query?query=up'
You'll get a response like this, with multiple metrics in the result - one for each scrape target:
{
  "status": "success",
  "data": {
    "resultType": "vector",
    "result": [
      {
        "metric": {
          "__name__": "up",
          "instance": "fulfilment-api:80",
          "job": "fulfilment-api"
        },
        "value": [
          1626510366.389,
          "1"
        ]
      },
      {
        "metric": {
          "__name__": "up",
          "instance": "fulfilment-processor:9110",
          "job": "fulfilment-processor"
        },
        "value": [
          1626510366.389,
          "1"
        ]
      },
      {
        "metric": {
          "__name__": "up",
          "instance": "node-exporter:9100",
          "job": "node-exporter"
        },
        "value": [
          1626510366.389,
          "1"
        ]
      }
    ]
  }
}
The up metric is a gauge. Prometheus metrics can be any decimal value, but this metric only uses two - 1 to mean the target is up and is being scraped, and 0 to mean the target is down and can't be scraped.
The API response shows the timestamp for every metric, aalong with the instance and job labels. The metric name is actually stored as a label too: __name__.
Lab
Sometimes you want to see the current metric value, but usually you want to see the changing values over time.
Use the API to query the values of the fulfilment_in_flight_total metric for the last hour.
Cleanup
Cleanup by removing all containers:
docker rm -f $(docker ps -aq)